Public domain
Comparing Sea Level During El Niño Events
From the collection of NASA Image and Video Library. Free to download, adapt and use — no permission needed.
About this work
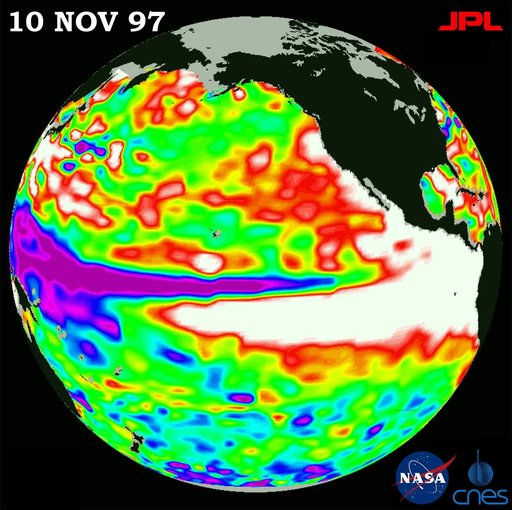
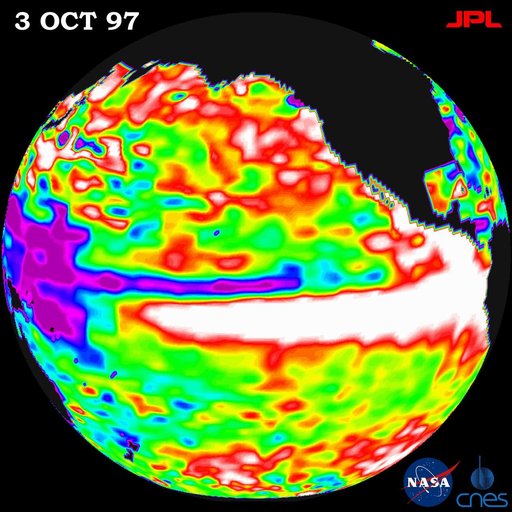
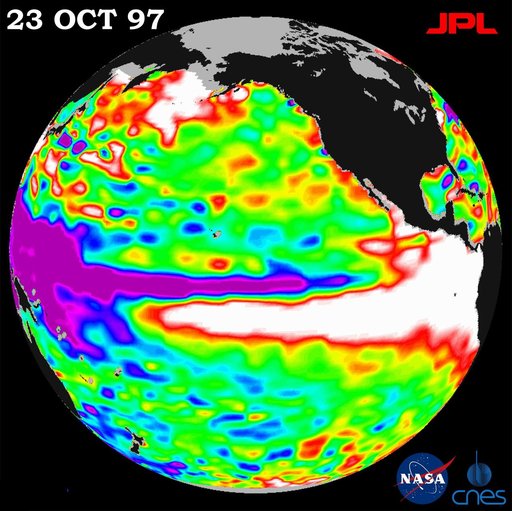
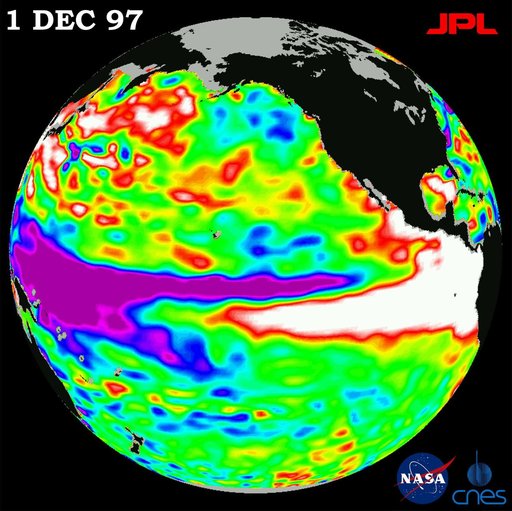
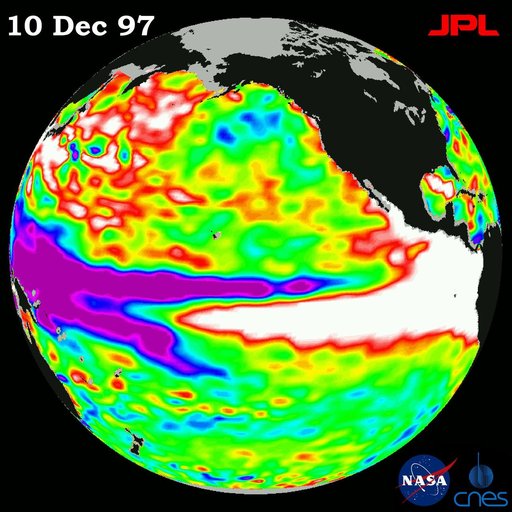
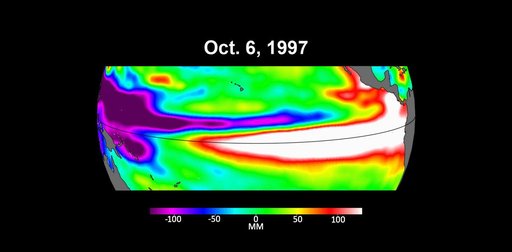
These three maps based on satellite data show sea levels in the Pacific Ocean during developing El Niño events in early October of 1997, 2015, and 2023. Higher-than-average ocean heights are shown in red and white, while lower-than-average heights are blue and purple. The two earlier maps represent the two extreme El Niño events from the past 30 years – the first from 1997 to 1998 and the second from 2015 to 2016.
NASA Image and Video Library’s own descriptionSubjects
Credit lineComparing Sea Level During El Niño Events. NASA/JPL, 2023-10-18. Public domain. ID: PIA26099.