Public domain
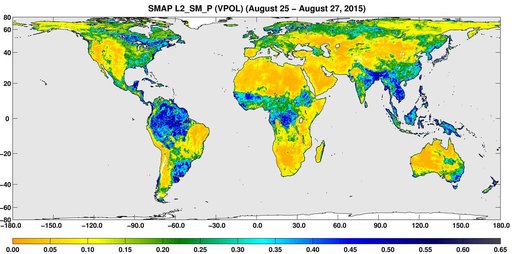
SMAP Global Map of Surface Soil Moisture Aug. 25-27, 2015
From the collection of NASA Image and Video Library. Free to download, adapt and use — no permission needed.
About this work
A three-day composite global map of surface soil moisture as retrieved from NASA SMAP radiometer instrument between Aug. 25-27, 2015. Dry areas appear yellow/orange, such as the Sahara Desert, western Australia and the western U.S. Wet areas appear blue, representing the impacts of localized storms. White areas indicate snow, ice or frozen ground.
NASA Image and Video Library’s own descriptionCredit lineSMAP Global Map of Surface Soil Moisture Aug. 25-27, 2015. NASA/JPL, 2015-09-02. Public domain. ID: PIA19877.
Similar works
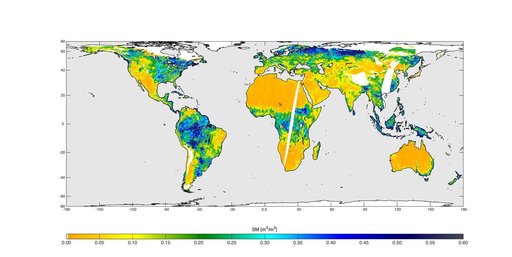 High-Resolution Global Soil Moisture Map
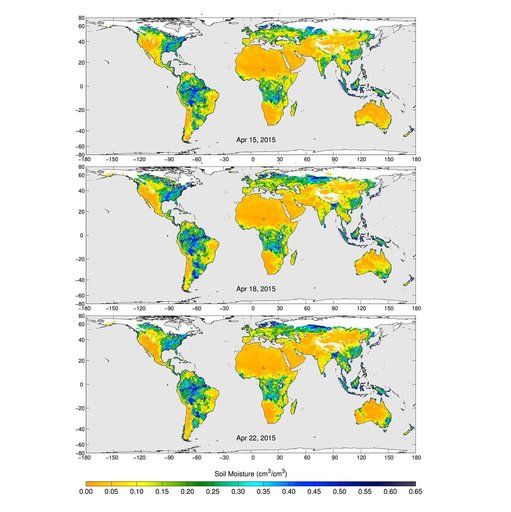 SMAP Radiometer Captures Views of Global Soil Moisture
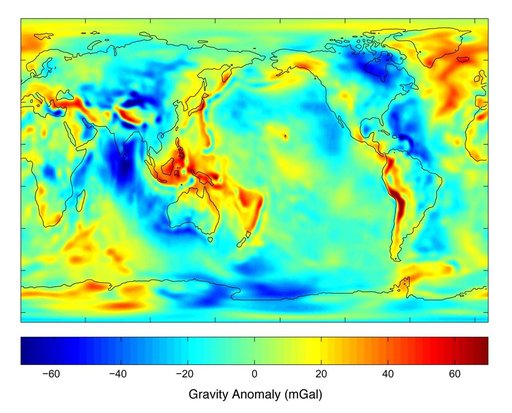 New Views of Earth Gravity Field from GRACE
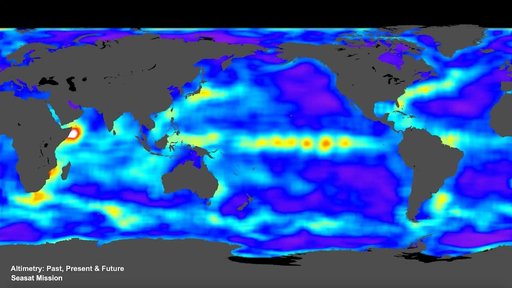 SWOT Satellite will Improve Clarity and Detail of Sea Height Measurements
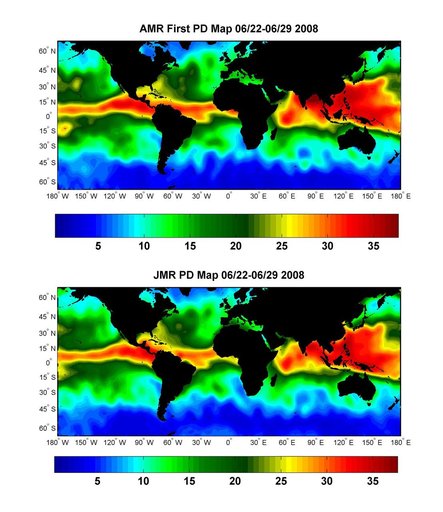 Global Views of Atmospheric Water Vapor:<br />First Data from OSTM/Jason-2 Advanced Microwave Radiometer
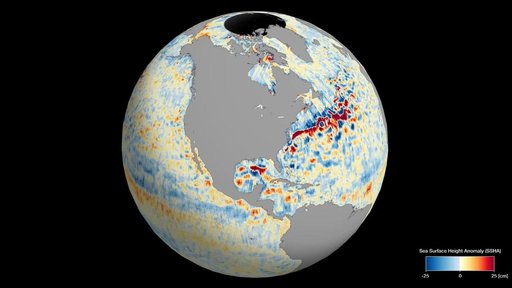 SWOT's Detailed View of Global Sea Level